· Tutorials · 4 min read
How to instrument observability in Kong
Observability is one of the major concern when managing a platform of scale. Kong provides lot of plugins to integrate with most familiar tools in the market. Here we will see how Kong can integrate onto any platform of choice supported by fluent-bit for logs and metrics and otel for traces.
It’s also published as a webinar in CNCF, if you would like to rather hear me talk about it.
Pre-requisites
- Kong Konnect / any Kong deployed
- Minikube/any K8s Cluster (with Helm)
- New Relic Account (Free)
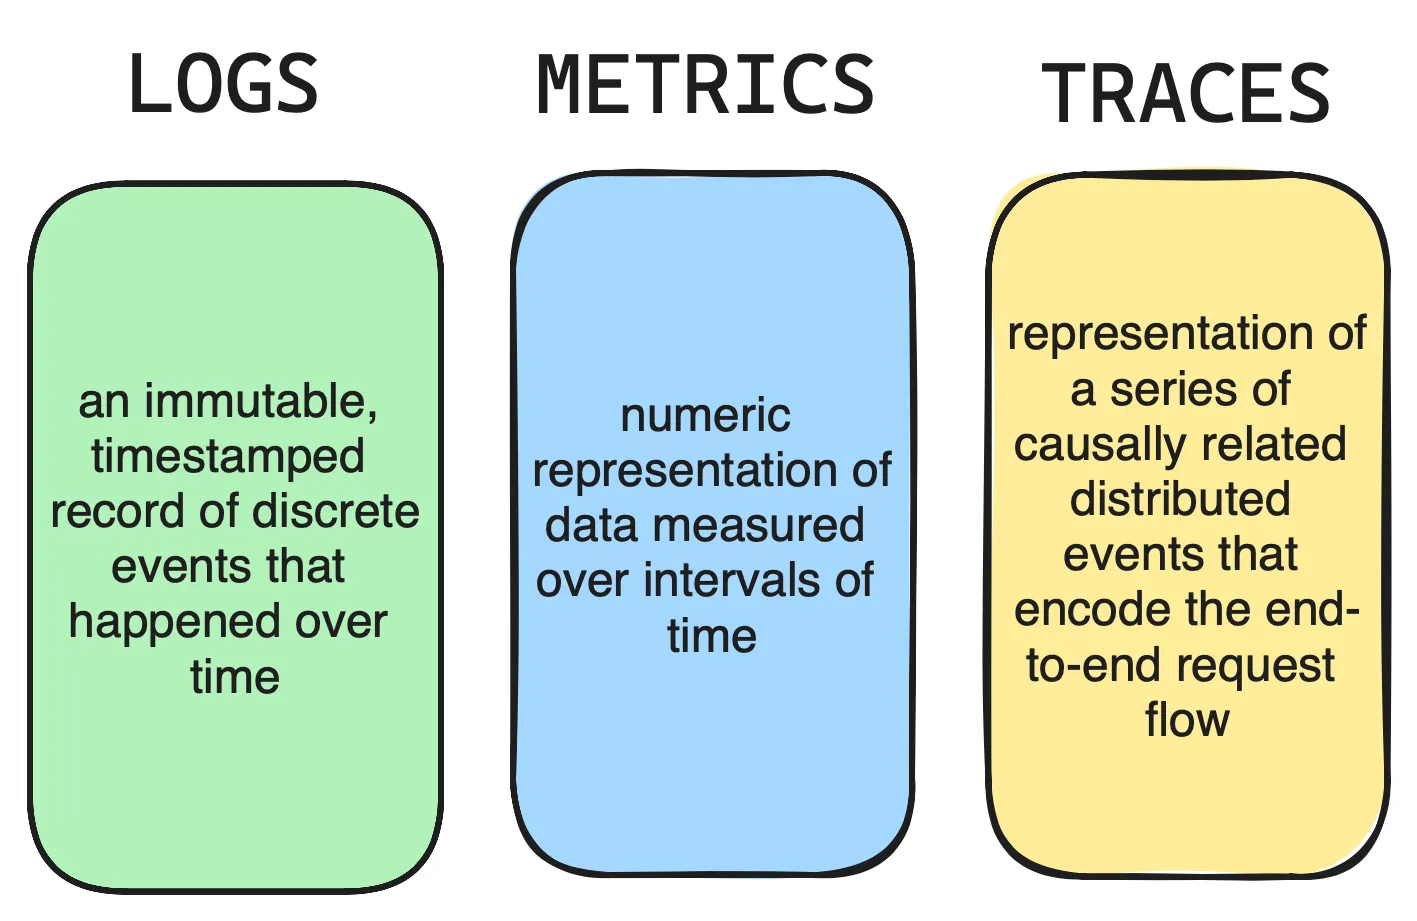
3 Pillars of Observability
The three pillars of observability are logs, metrics, and traces. These three data outputs provide different insights into the health and functions of systems in Kong.
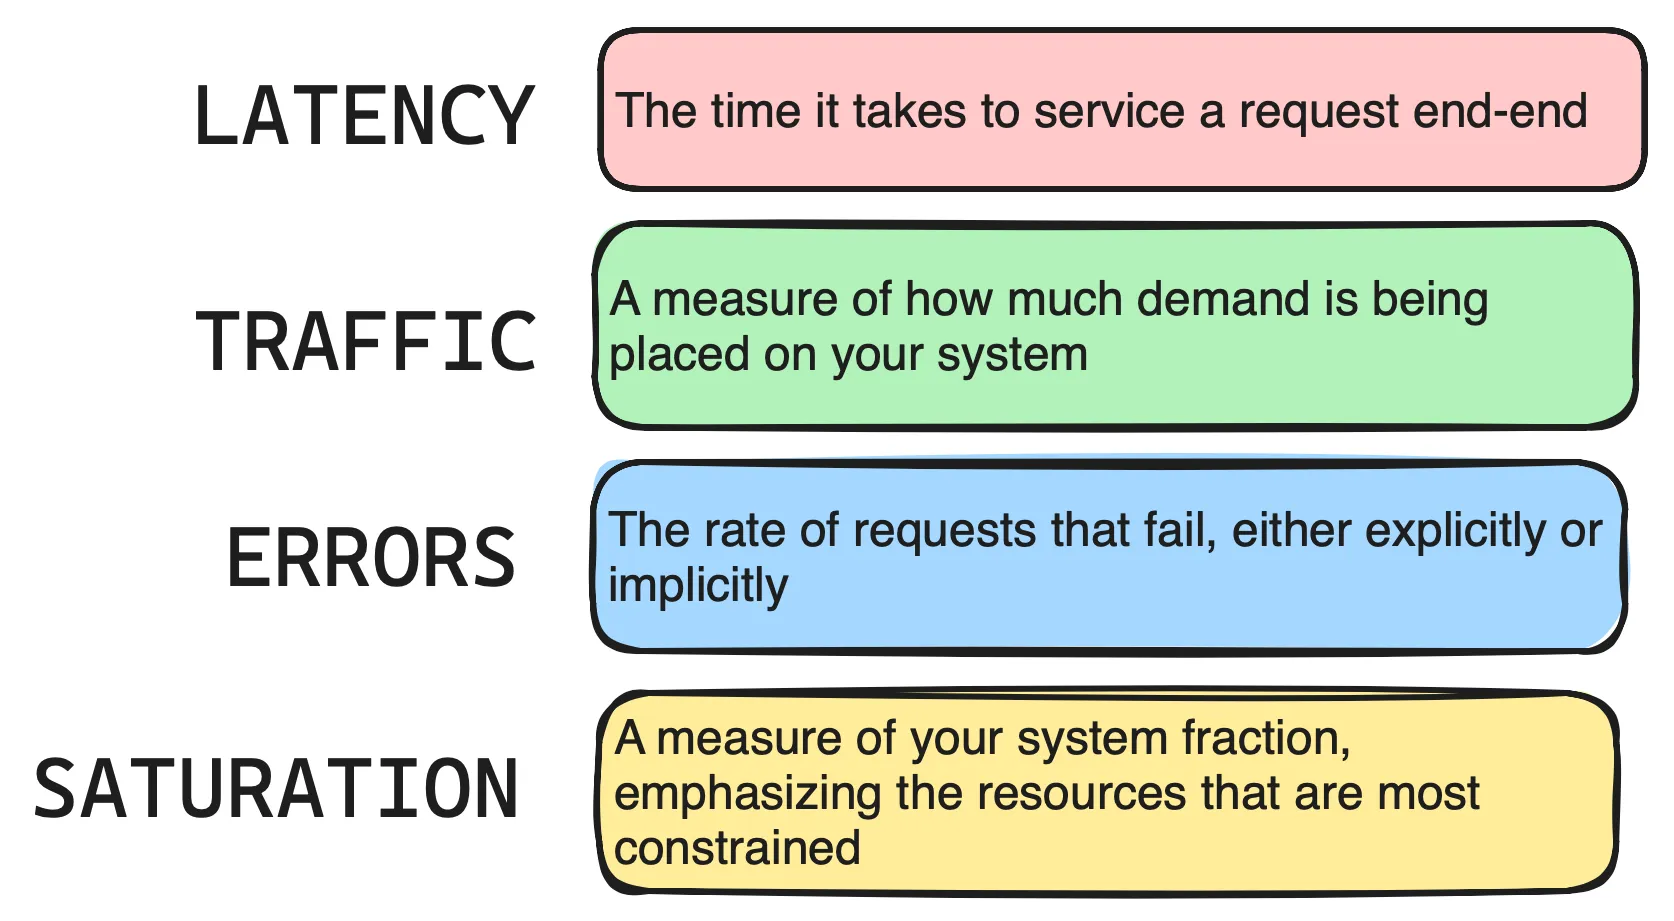
4 Golden Signals in Monitoring
As per Google SRE, you need to make sure to monitor at least below 4 signals in order to have good monitoring and gives you insight into the application being monitored.
Open Source tooling
There are lots of tools in the market to capture and monitor your applications, in-order have high availability for your system. Today you will learn about two open source tools that helps in achieving this.
fluent-bit: a lightweight, open-source telemetry agent for Logs, Metrics built for performance.Designed for speed, it collects events from diverse sources without bogging down your system. read more
openTelemetry: tool to create and manage telemetry data such as traces, that can be used with a broad variety of backends. Streamline your monitoring stack by routing all telemetry through a single endpoint. read more
Kong Plugins
Kong provides extensive support in integrating with logging and monitoring tools through plugins.
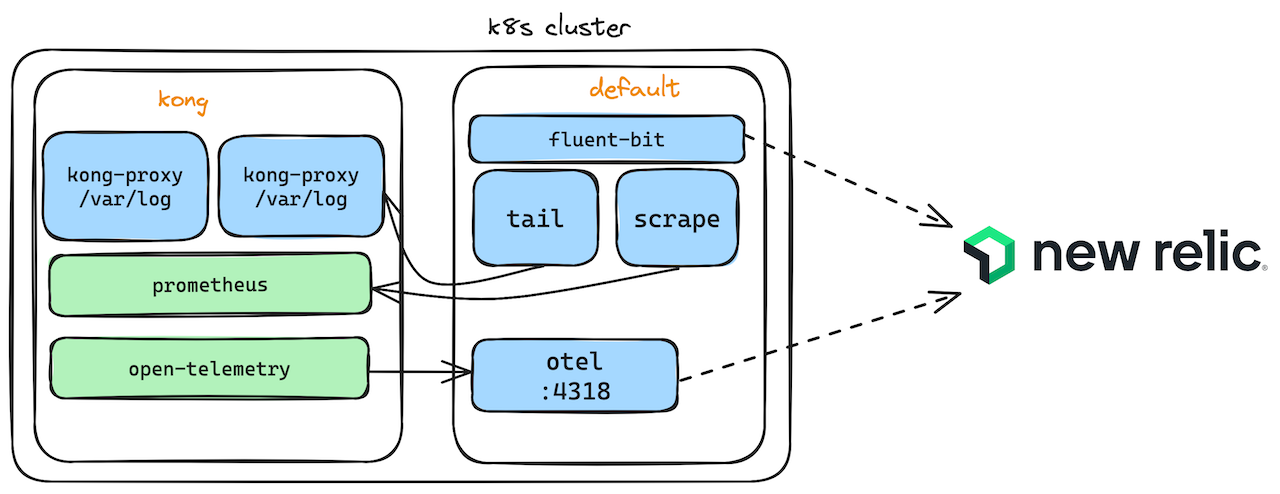
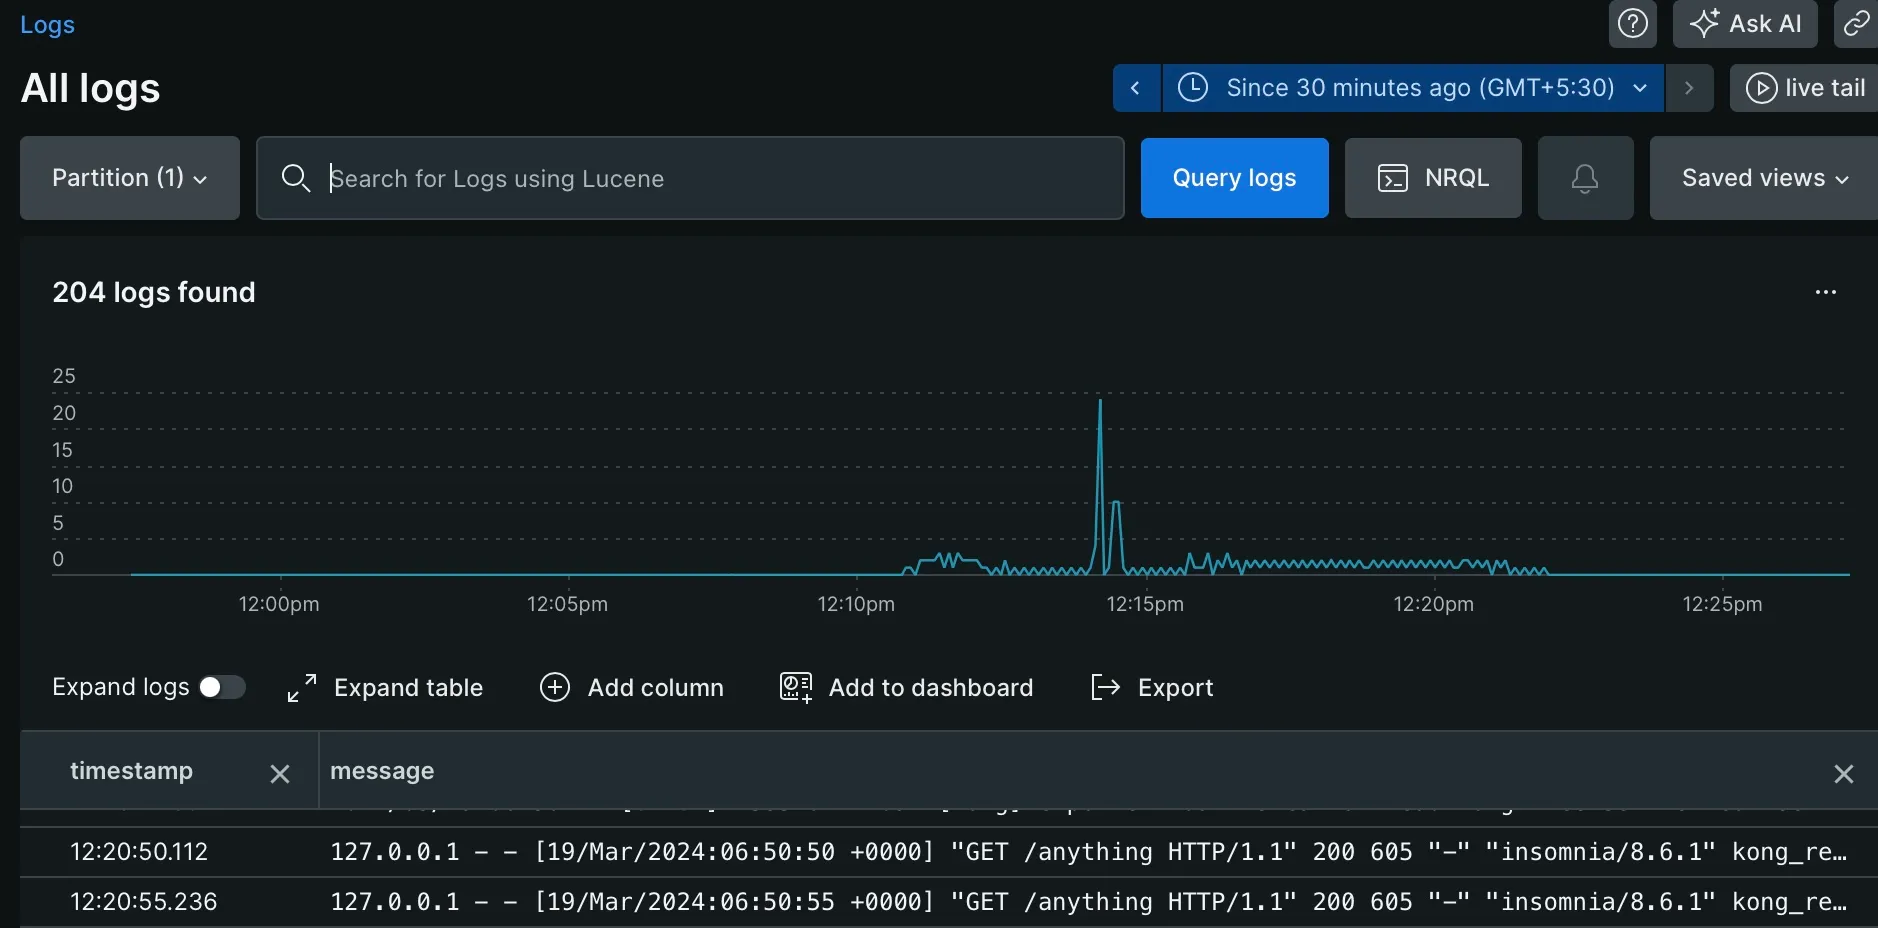
Logs: For gathering logs, we have plugins like FileLog or Syslog as common ways. But since we are running Kong in K8s cluster, we can also instrument cluster level logging through fluent-bit. It’s a processor which runs in your cluster and forwards the logs being written inside the container to the destination configured in your fluent config.
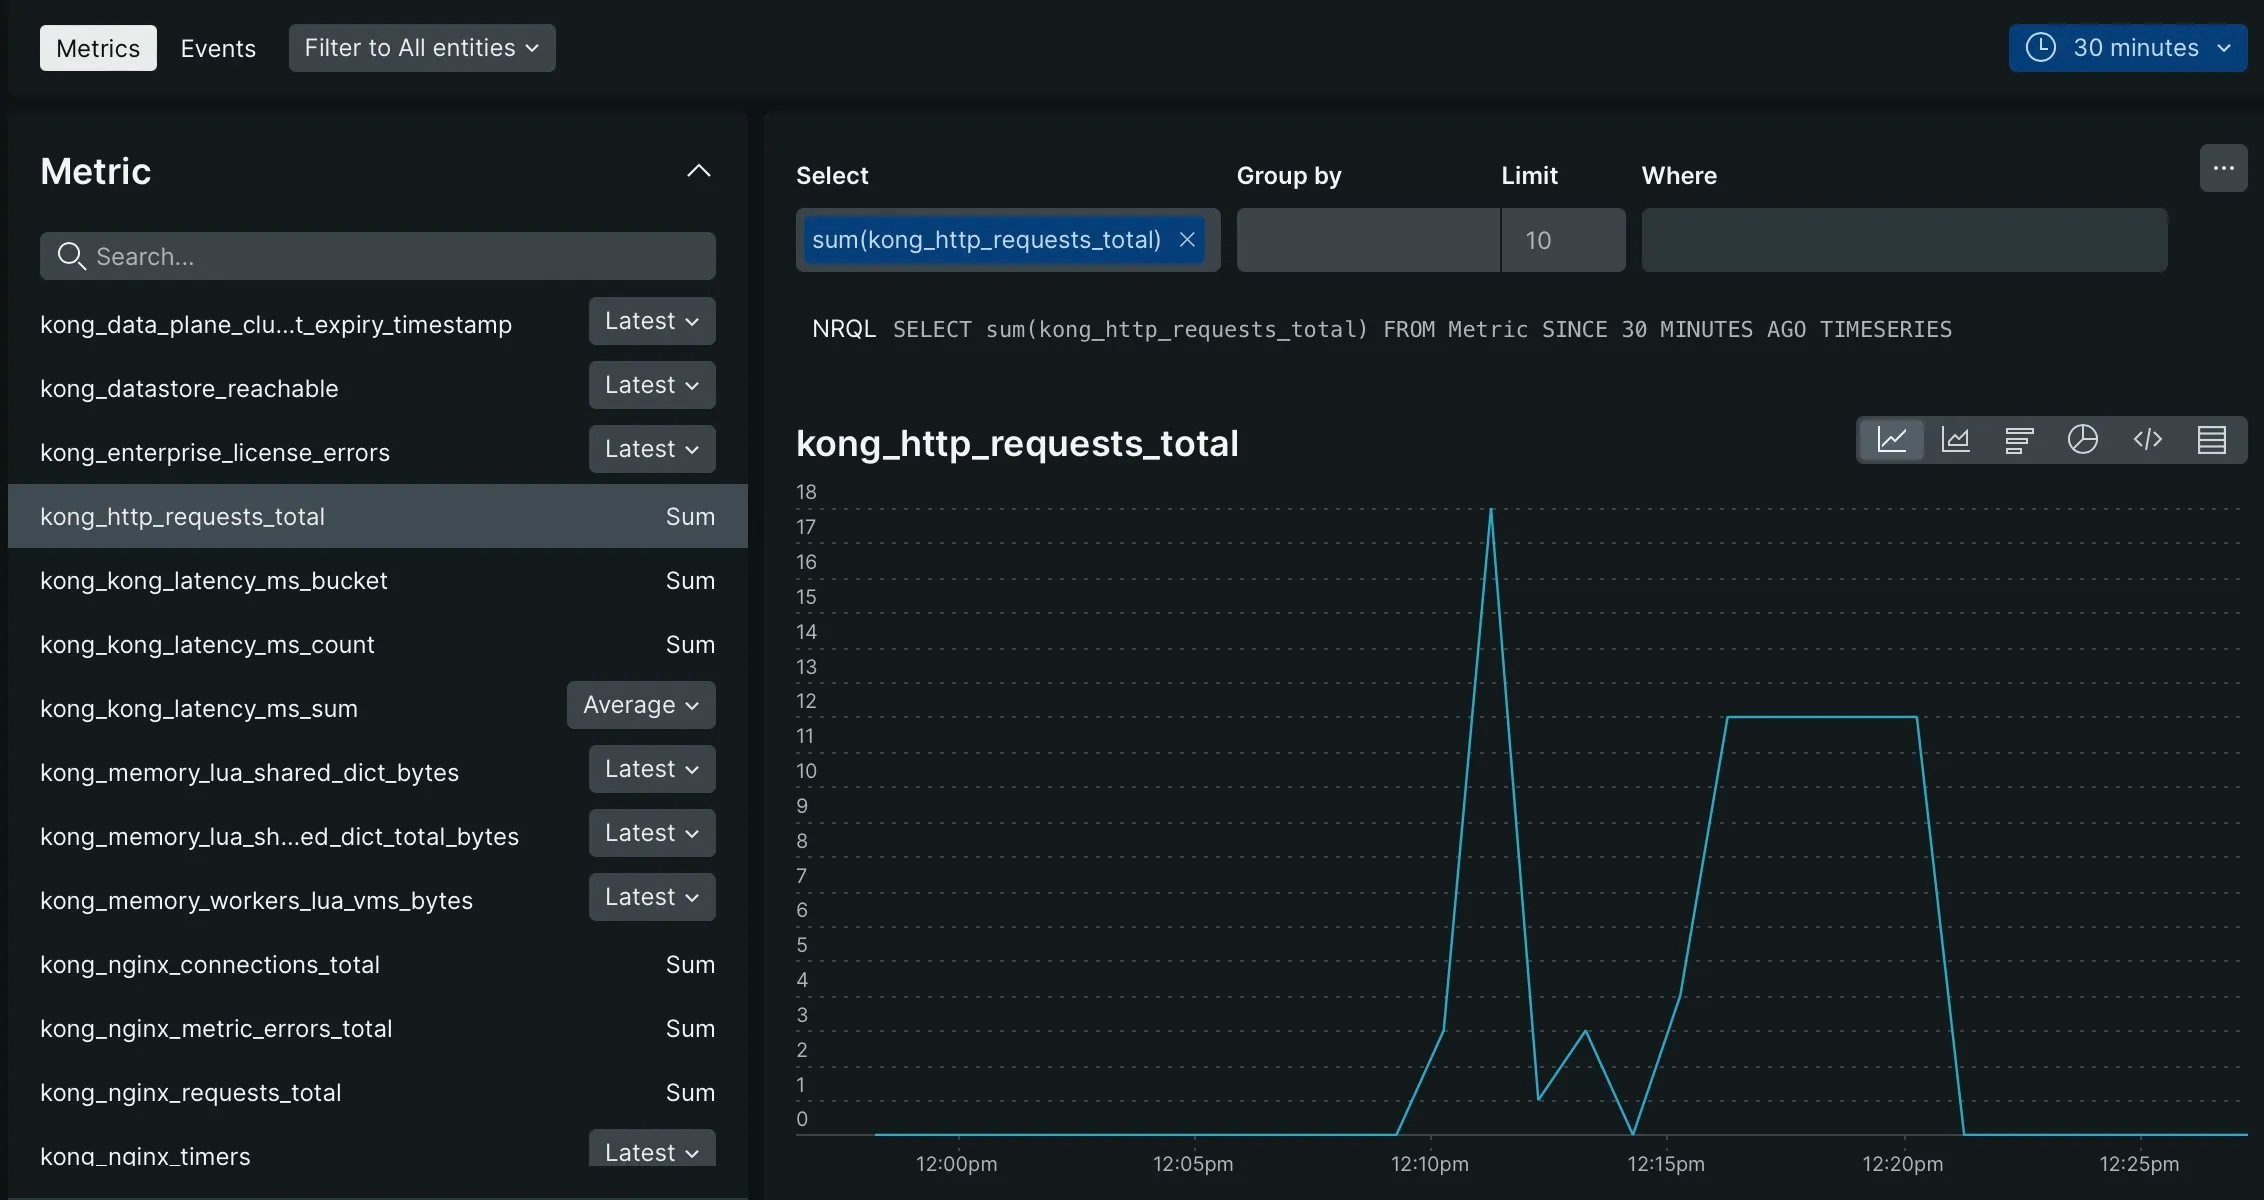
Metrics: These are Prometheus format metrics about the application system and for kong, it’s exposed through 8100 port from your data planes. By default Kong provides writes some metrics but in case if you need additional metrics, we can use the Prometheus plugin and enable the metrics required.
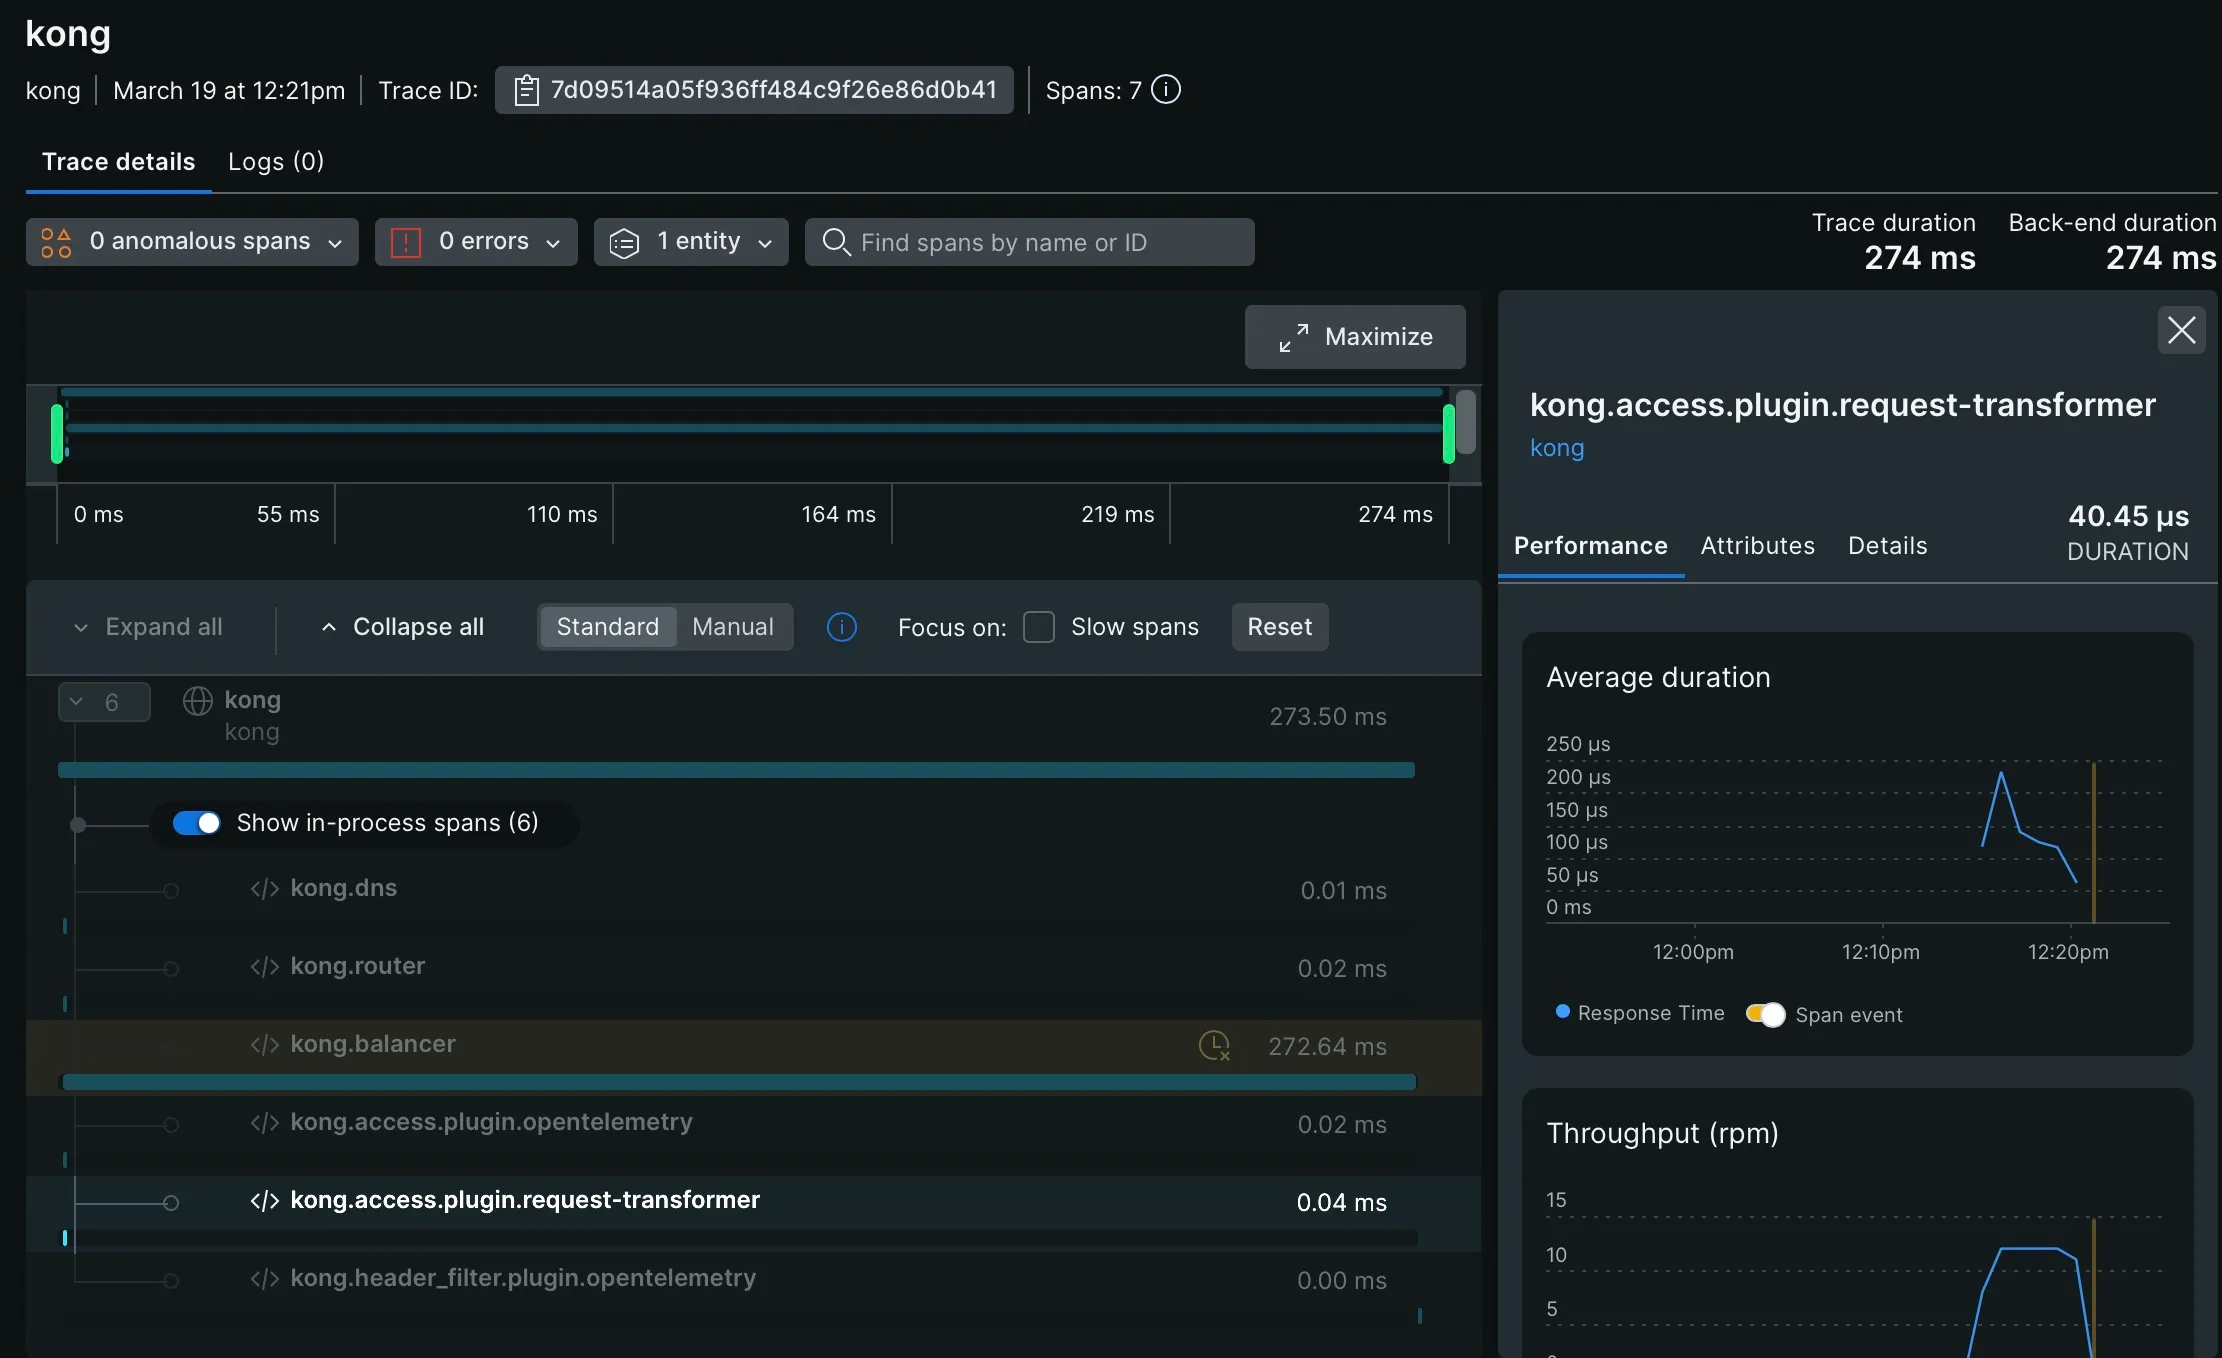
Traces: For gathering traces, we have OpenTelemetry plugin which helps you to capture them and forward it to a collector which can then be stored in a centralised system for monitoring.
Setup
You will need a K8s cluster (Minikube/any other) and Helm installed. Follow along this blog for setting up Kong Platform. Clone the repo for using quick start utilities which helps setup the dependencies for you.
You need to enable the tracing at Kong data planes level, hence inject the below environment variables if you are using Helm charts,
env:
tracing_instrumentations: all
tracing_sampling_rate: 1.0
In order to deploy the plugin configurations, you can use Kong decK cli tool which deploys your config using a declarative yaml file (instead of configuring in UI). Navigate to the monitoring folder and run
deck gateway sync otel.yml --select-tag otel

deck gateway sync prometheus.yml --select-tag prometheus
Also configure any service and route with few plugins of your choice.
In order to run the fluent-bit and Otel collector in your K8s cluster, navigate to monitoring folder of repository and edit the config entries in files tools/fluent-bit.yml and files/otel-collector.yml (search and replace API-KEY from your new-relic account) and then run the shell script,
./start-fluent.shNow, start sending traffic to your services via routes configured using tools like curl or any rest client. You will start to see the information flowing to system that you have integrated (New Relic).
New Relic Integration
The choice of storing your observability data in a centralised system will depend on your current Enterprise tooling and whether you are comfortable with Buy vs Build. In this blog, I have used New Relic which provides you with Free usage of upto 100G per month and it’s a managed offering (SaaS). All you need is to signup for an account and you will get a License Key which will be used to configure in the tooling and you can start to see all three datas from your system.
This is a very simple setup of enabling observability in Kong for systems that are deployed and managed by you. The tools required for enabling this like fluent-bit and otel-collector are also to be managed by you which is not a simple operations. I haven’t discussed about the operation challenges in doing these activities.
Hope this helps in setting up a similar observable system with any other tools of your choice. Please let me know your feedback and comments if there is a better way to do this.